Chapter 10: Managing for Extreme Weather
Table of Contents

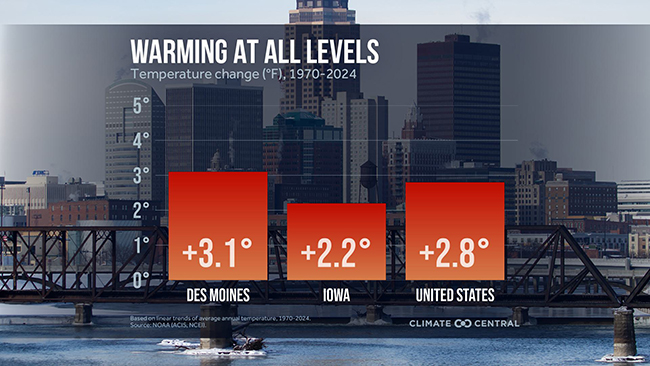
Des Moines’ and Iowa’s average annual temperatures have increased by 3.1 and 2.2 degrees, respectively, since 1970, following national trends (see Figure 10.1). Although this change might not seem like a lot, it is already having far-reaching consequences. Warmer air results in more evaporation of surface water from ponds, lakes, and rivers, releasing moisture into the atmosphere. Warm air can also hold more water vapor than cold air. For these reasons, rising temperatures are generally associated with increased precipitation. Overall, annual precipitation in Iowa increased by 4.1 inches between 1979 and 2021, with some parts of the state becoming wetter and other parts becoming drier.
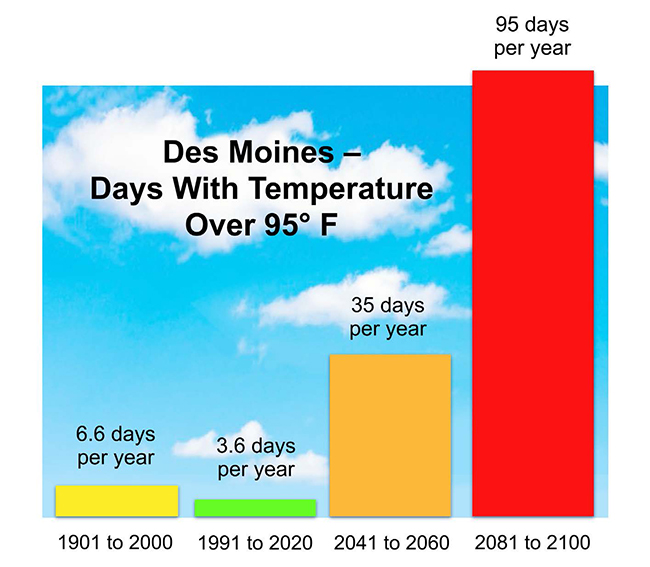
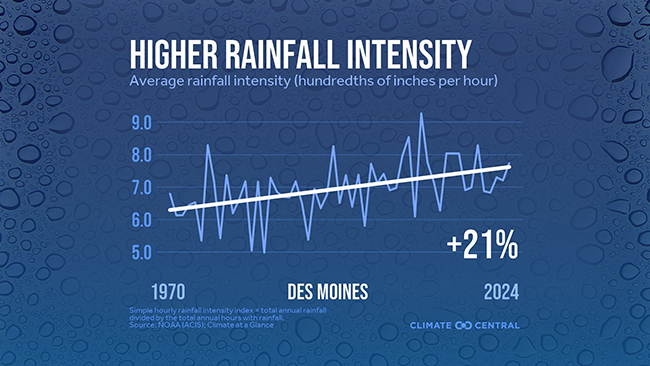
Iowa’s weather has also become variable and extreme in recent decades, including more days with extreme heat (see Figure 10.2) and higher rainfall intensity (see Figure 10.3). This trend is expected to continue in Iowa and worldwide.
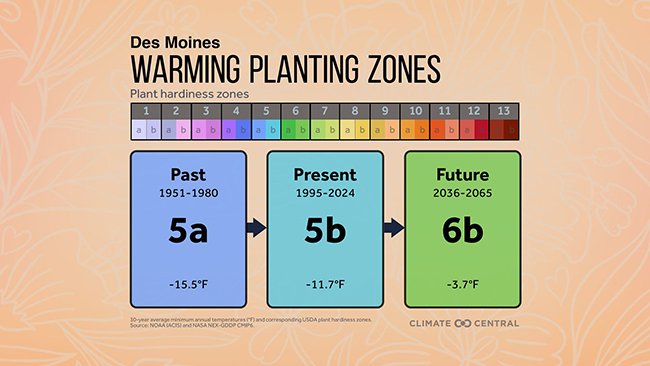
The outcomes of these continued changes in weather conditions, such as an increase in the duration of the growing season for native plants, flooding, erosion, dry conditions, and advantageous conditions for invasive species, can impact integrated roadside vegetation management (IRVM) practices. For example, plant hardiness zones, which are set by the United States Department of Agriculture to indicate which plants can survive the coldest expected temperatures felt during the year in a given place, are getting warmer (see Figure 10.4). Scientists are projecting the following additional direct and indirect weather-related impacts in Iowa in the coming years.